What Does a DeFi Network Actually Look Like?
Every blockchain network has a physical fingerprint. We're mapping them.
There's a strange gap in how we think about decentralised networks. We talk about them in abstractions (consensus mechanisms, validator counts, stake distributions) but rarely ask the most basic question: what does this thing actually look like?
Not the token flow diagrams. Not the architecture docs. The real, physical network: the machines, the latency between them, the way each one responds when you knock on its ports. That layer is invisible in normal operation, and almost nobody is watching it.
We started watching it.
Every port has a heartbeat
When a machine receives a TCP SYN packet, it responds with a SYN-ACK. The time that takes, measured at the kernel boundary in microseconds, is remarkably consistent for a given machine and service. An SSH daemon on a well-provisioned validator in Frankfurt will respond in a tight band, every time. The same service on an overloaded VPS in a budget datacenter will respond differently: not just slower, but with a different shape to its timing.
This is the core insight behind timing fingerprinting: the response latency of a network service isn't just a number, it's a signature. Capture enough samples and you can build a high-dimensional vector, what we call a Network Timing Embedding (NTE), that characterises how a machine behaves at the network level.
We do this with Limpet, our open-source scanner built on Linux eBPF/XDP. It sends raw SYN packets and captures responses at the kernel boundary before they hit userspace, giving nanosecond-precision measurements that aren't polluted by application-level noise. Each scan produces a 64-dimensional embedding per port, enough to capture the subtle timing characteristics that distinguish one machine from another.
Mapping DeFi validator networks
We pointed Limpet at 1,075 hosts across multiple DeFi validator networks including Sui and Solana. The scan covered 3,001 individual port-level services: SSH, HTTP, HTTPS, SMTP, PostgreSQL, and more. For each one, we collected five raw SYN-ACK timing samples and computed a 64-dimensional NTE vector.
Then we asked: if you project all 3,001 timing fingerprints into two dimensions, what structure emerges?
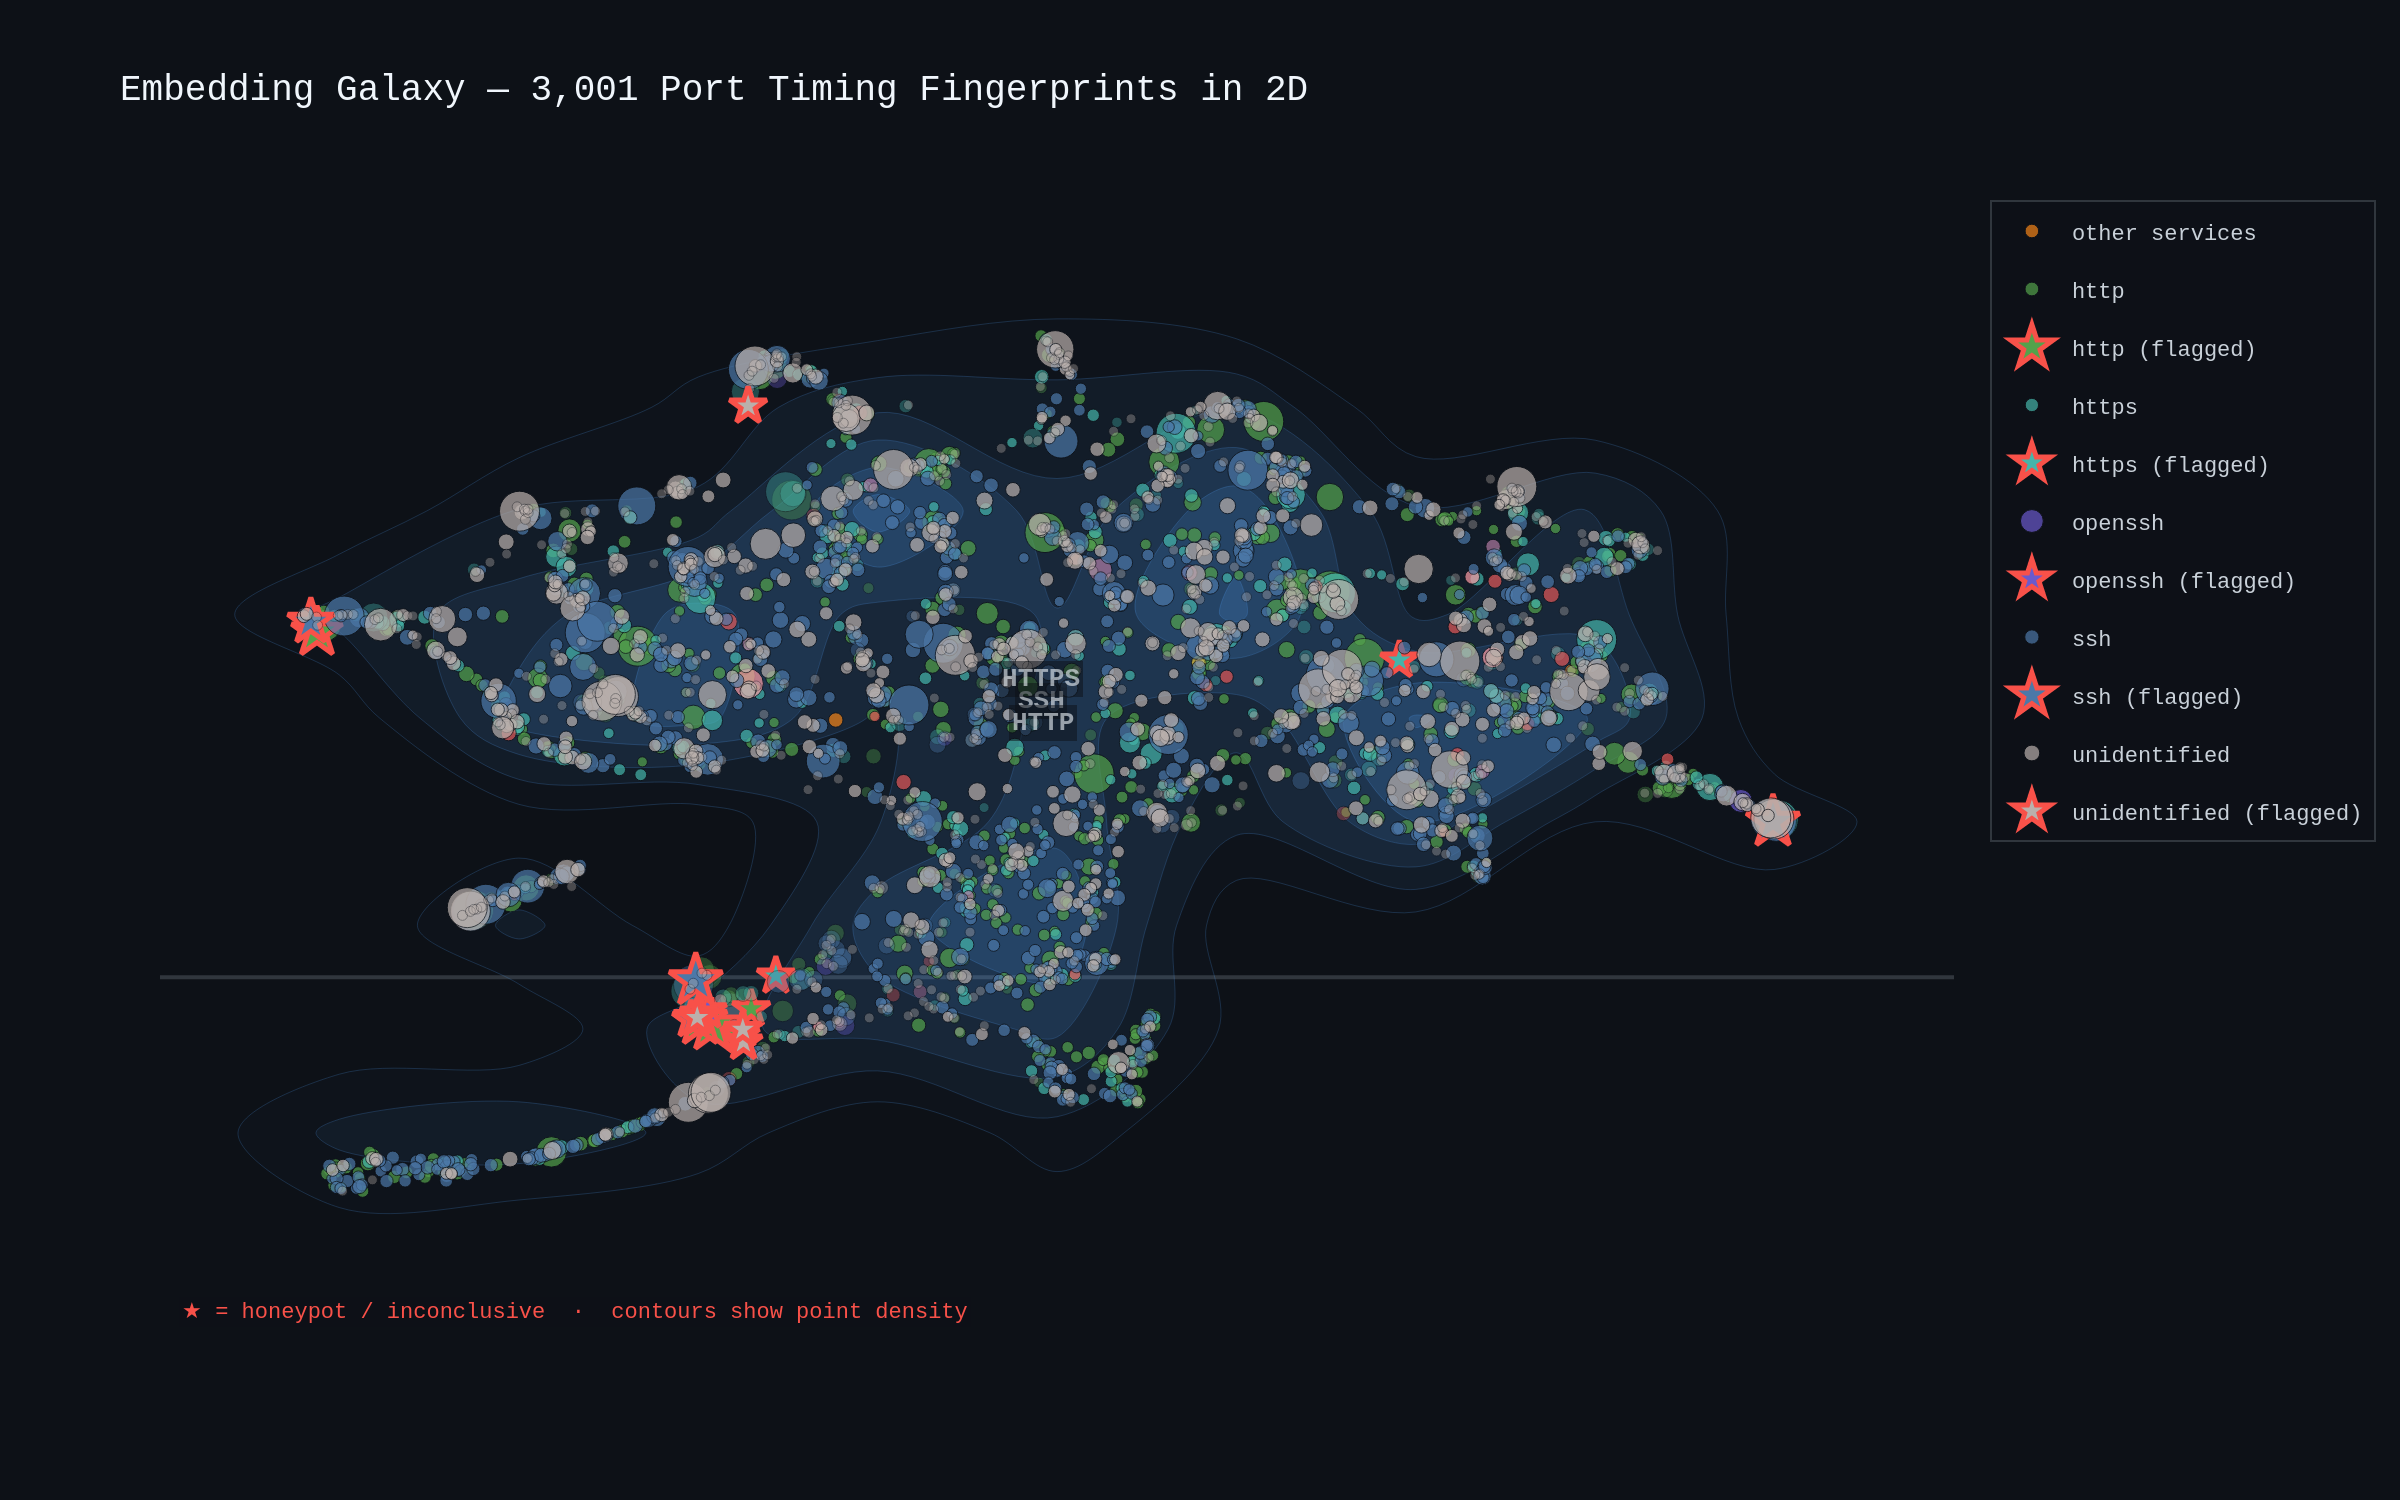
The answer: a lot. Services with similar kernel-level timing behaviour cluster together naturally. SSH occupies one region of the space, HTTP another, HTTPS another still. This isn't because we told the algorithm what service was running: the clustering emerges entirely from timing data. The network is telling us its own structure.
The size of each point reflects the standard deviation of the timing samples. Tight, small dots are services responding with metronomic consistency: real infrastructure doing real work. The larger, more scattered points are noisier. And the red-outlined stars sitting in anomalous positions? Those are flagged hosts: machines whose timing behaviour doesn't match what a legitimate service should look like.
Why timing matters for security
This isn't academic. Timing fingerprints expose things that traditional scanning misses entirely.
Honeypot detection. A honeypot can fake a banner. It can pretend to be OpenSSH, serve a valid HTTP response, even mimic version strings. What it can't easily fake is the kernel-level timing signature of the real service it's impersonating. Across these networks we flagged 5 likely honeypots and 13 inconclusive hosts. The honeypots showed timing jitter significantly higher than legitimate infrastructure, and on a shared scale, the difference is visible at a glance.
Infrastructure health. The anomaly data from a continuous scan tells you when something changes. A validator that suddenly takes over a second to respond on a port that normally replies in 3ms isn't experiencing normal load variation. Something fundamental has changed. Hosts going completely silent mid-scan tell a different story again. During our scans, we observed over 600 hosts drop offline entirely: information that matters if you're assessing network resilience.
Validator diversity. The timing embeddings reveal whether a network's validators are genuinely distributed or whether many of them share underlying infrastructure. Machines in the same datacenter, on the same hardware, running the same configuration will produce similar embeddings. When a "decentralised" network's validators all cluster tightly in embedding space, that's a signal worth investigating.
What comes next
This is a first look, work in progress. The next post digs into the data: the jitter fingerprints that separate real nodes from suspicious ones, the RTT distribution patterns by service type, and what the anomaly layer tells us about infrastructure volatility across these networks. Later, we'll break the data down by individual network (Sui, Solana, and others) to see how their physical topologies compare.
If you operate validator infrastructure, build DeFi protocols, or invest in networks that claim to be decentralised, the physical layer is where the truth lives. We're going to show you what it looks like.
Related Posts
DeFi Under the Microscope: 1,075 Hosts, 3,001 Ports, One Timing Scan
A first look at what DeFi validator infrastructure looks like at the kernel level. We crack open the consolidated dataset: embedding galaxies, jitter fingerprints, RTT ridgelines, and 10,000 anomaly events across 642 silent hosts.
What We Found Scanning the Sui Validator Network
We scanned 138 Sui validators across 20 countries using kernel-level temporal fingerprinting. 41% have SSH exposed, 57 run unexpected internet-facing services, and 9 confirmed CVEs sit on 4 hosts, including 2 critical at CVSS 9.8. Here is what we found and why it matters for DeFi.
Open-Sourcing Our Autonomous Defence Arsenal: Here's What's Inside
We're open-sourcing the tooling behind NullRabbit's autonomous kernel-level network defence: the scanning, intelligence, observation, and adversarial validation layers that feed our enforcement pipeline. Six tools, MIT licensed, with more coming.