Slashr: Real-Time Validator Incident Tracking Across Four Networks
Your validator went down at 3am. You didn't know. They didn't tell you. Your rewards stopped accumulating and nobody sent you a notification, an email, or even an apologetic tweet.
This is the problem Slashr solves.
Slashr is a live, cross-chain validator incident tracking platform built by NullRabbit. It monitors delinquency, jailing, slashing, and missed vote events across Solana, Ethereum, Sui, and Cosmos, in real time. Over 1,000 incidents have been tracked since launch, and the number climbs daily.
This post walks through what Slashr does today and the features we've shipped recently.
The Live Feed
The core of Slashr is the incident feed. Every time a validator goes delinquent, gets jailed, misses blocks, or gets slashed, it appears on slashr.dev within seconds. No manual reporting. No operator self-disclosure. Just the chain data, as it happens.
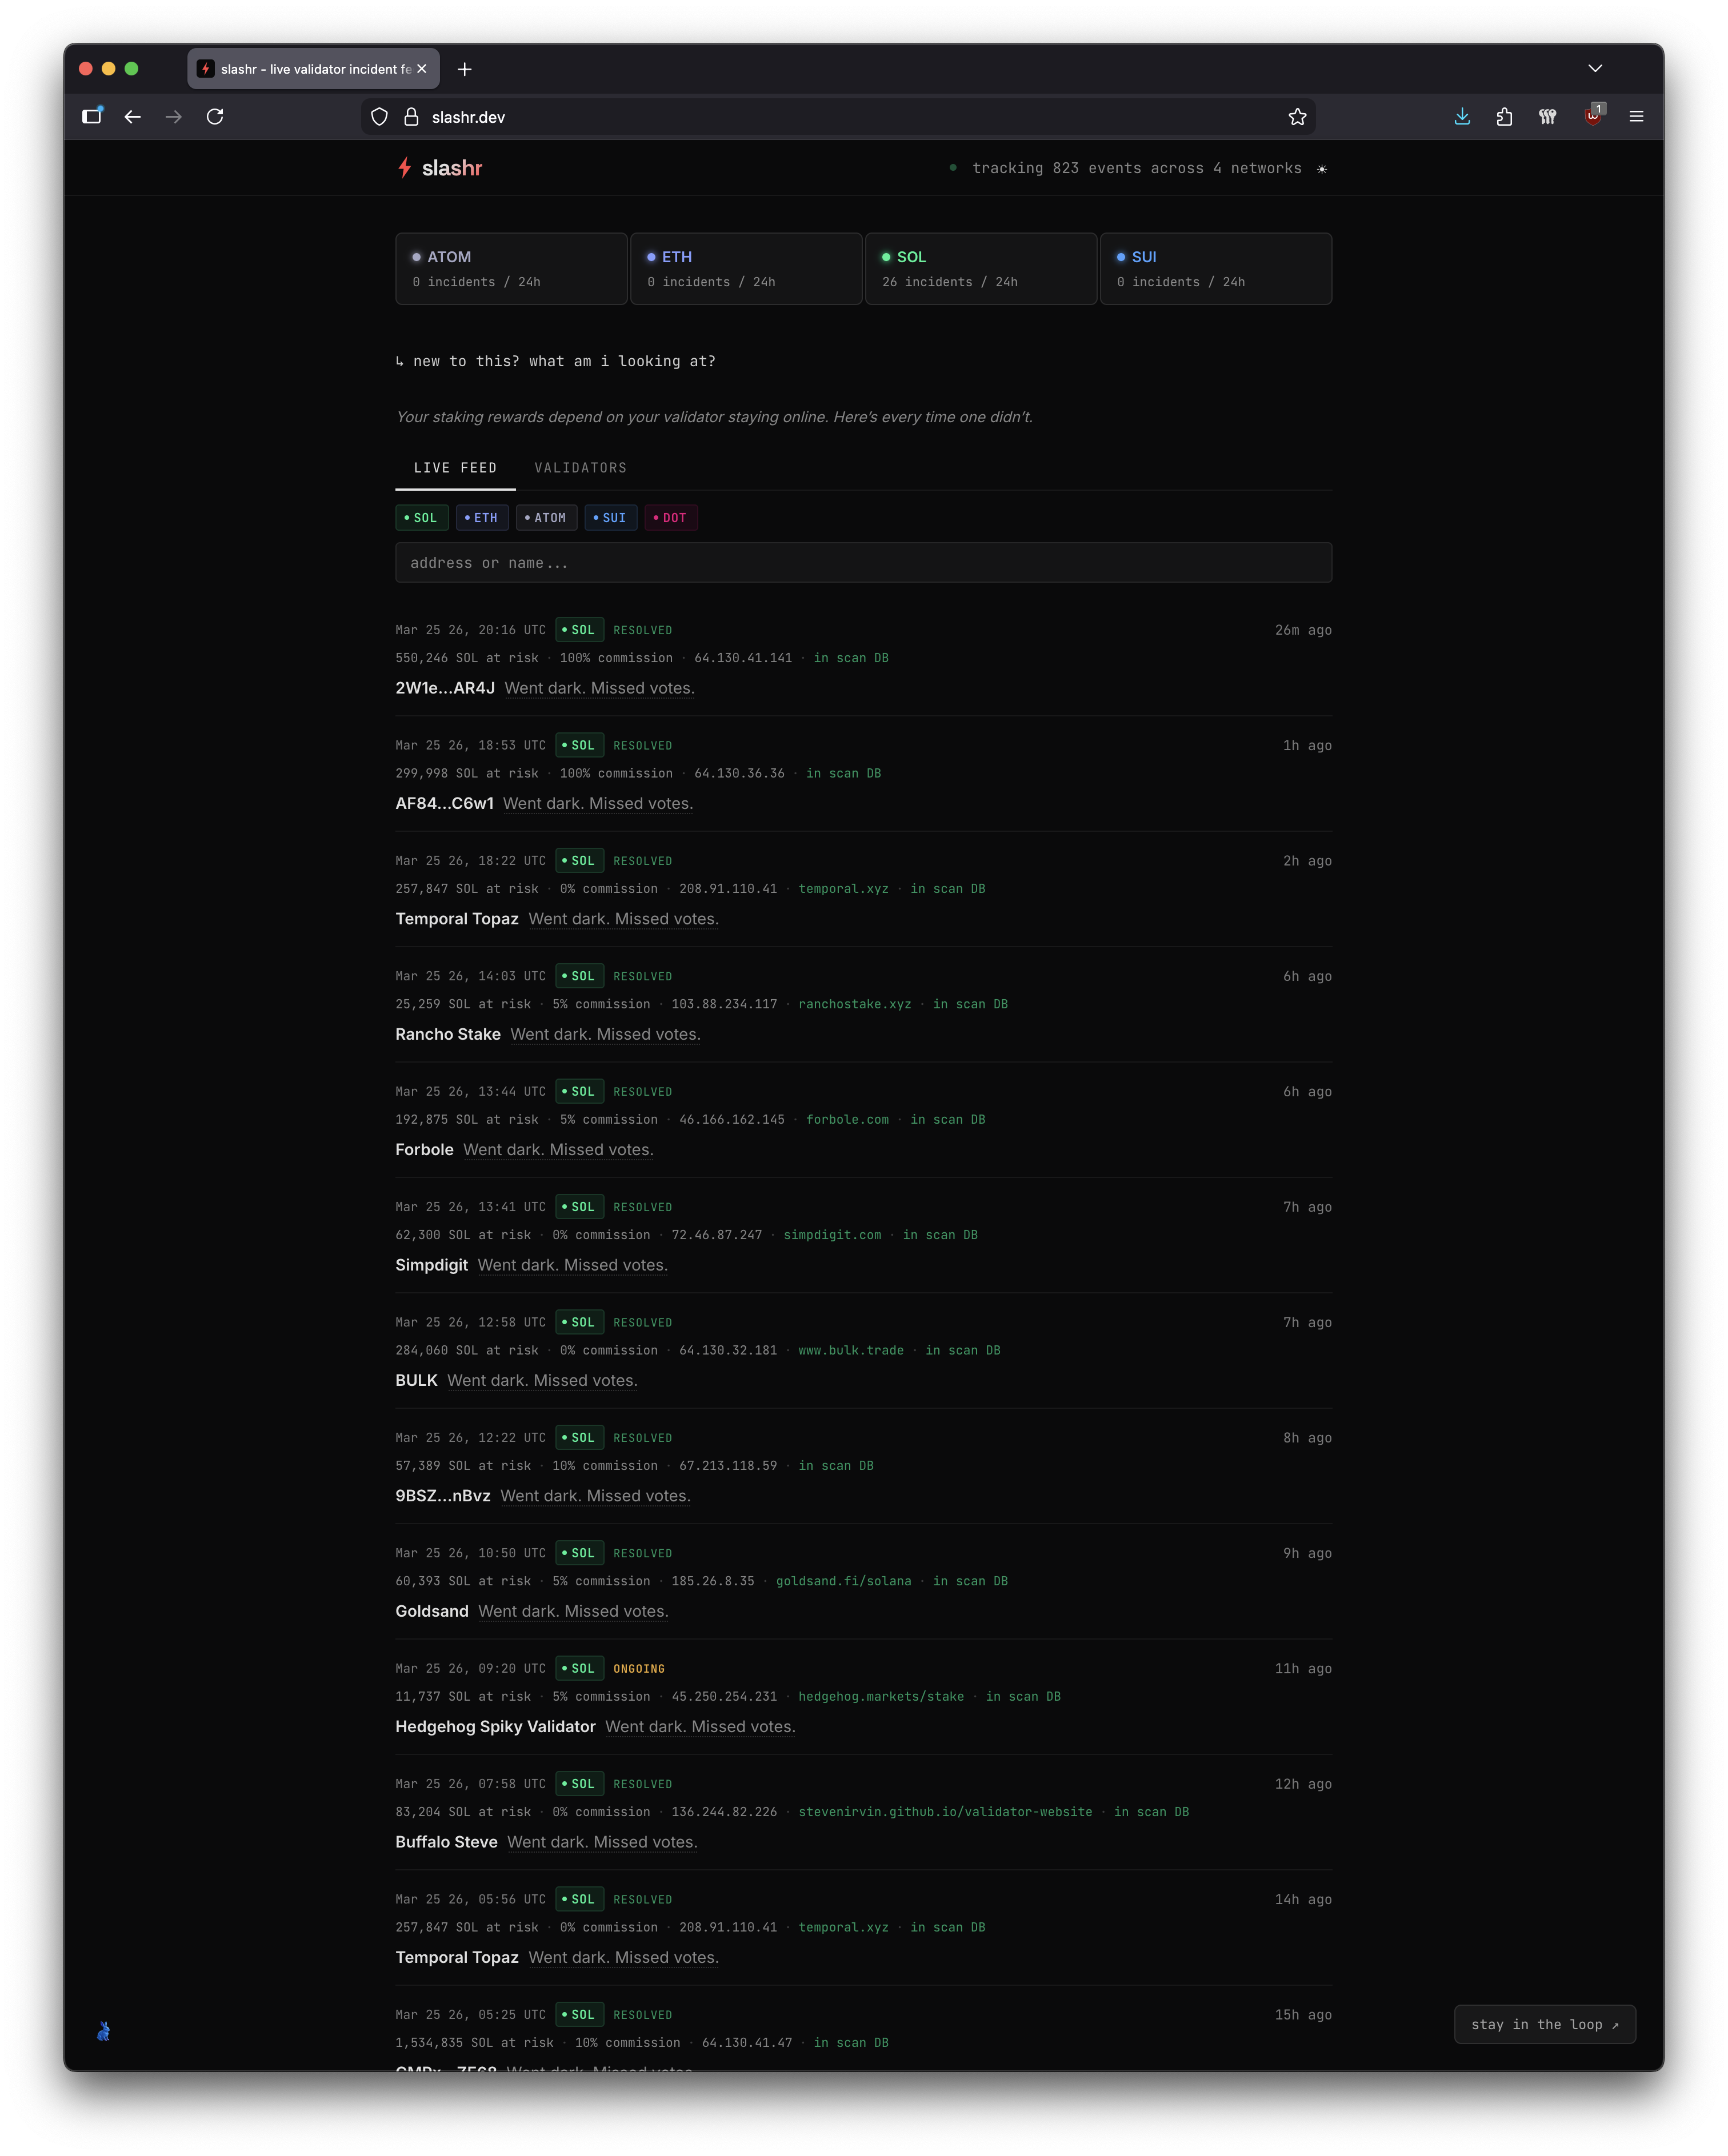
Each event is tagged by chain, severity, and validator identity, resolved where possible to a recognisable operator name rather than a raw address.
Check Your Wallet
The most practical feature for delegators: paste your wallet address at slashr.dev/check and instantly see the incident history for every validator you're staked with.
Slashr auto-detects which network you're on from the address format. Each validator gets a green, yellow, or red severity indicator based on their recent track record. If your validator has been going down repeatedly, you'll know. And you'll see the pattern.
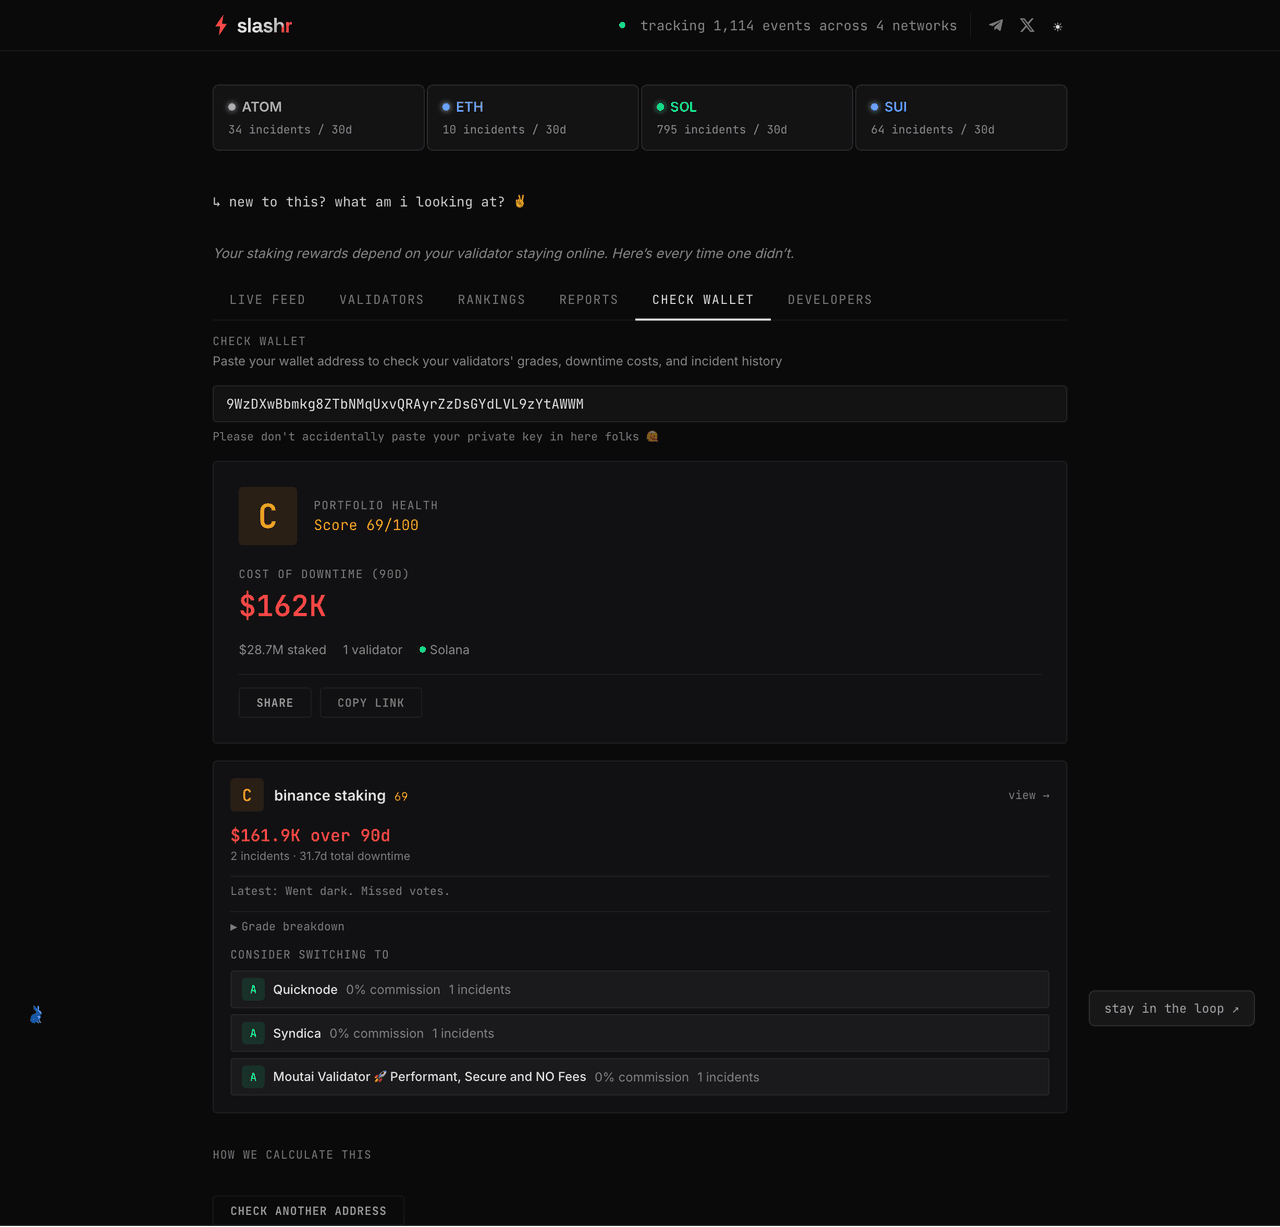
No sign-up. No API key. Just paste and see.
Validator Detail Pages
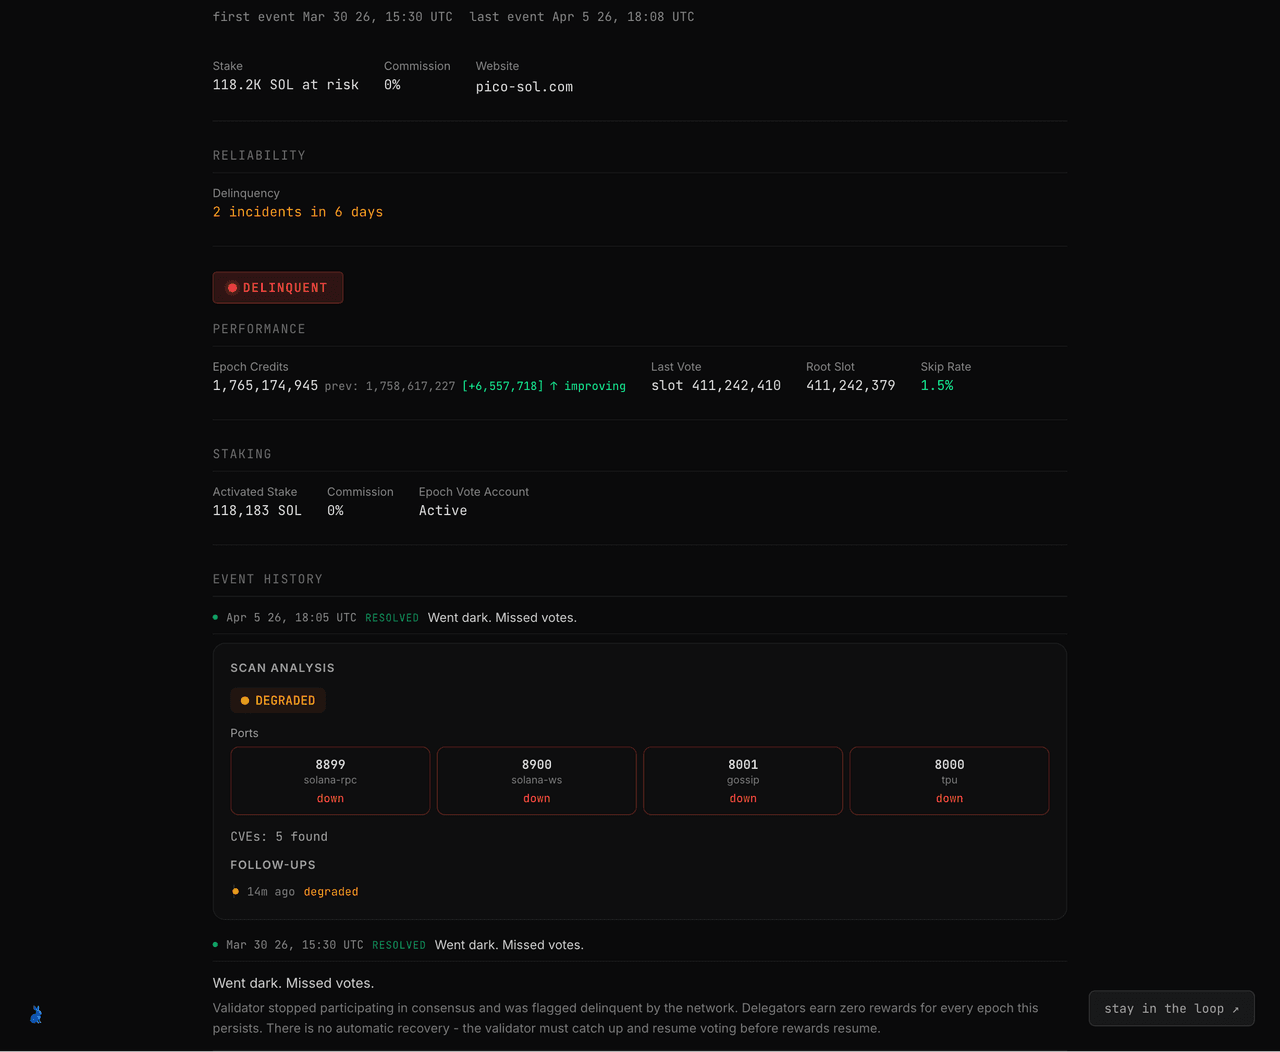
Every validator that appears in the feed gets a dedicated page with chain-specific performance data:
- Solana: Epoch credits with trend data, skip rate, last vote slot, root slot, activated stake, commission
- Sui: Voting power, gas price, commission, APY, at-risk epochs, pending stake/withdrawals
- Cosmos: Bonded status, jailed status, uptime percentage, jail risk, missed blocks counter
- Ethereum: Balance, effective balance, activation epoch, slashed status
These pages also include the full event history for that validator, plus any infrastructure scan results (more on that below).
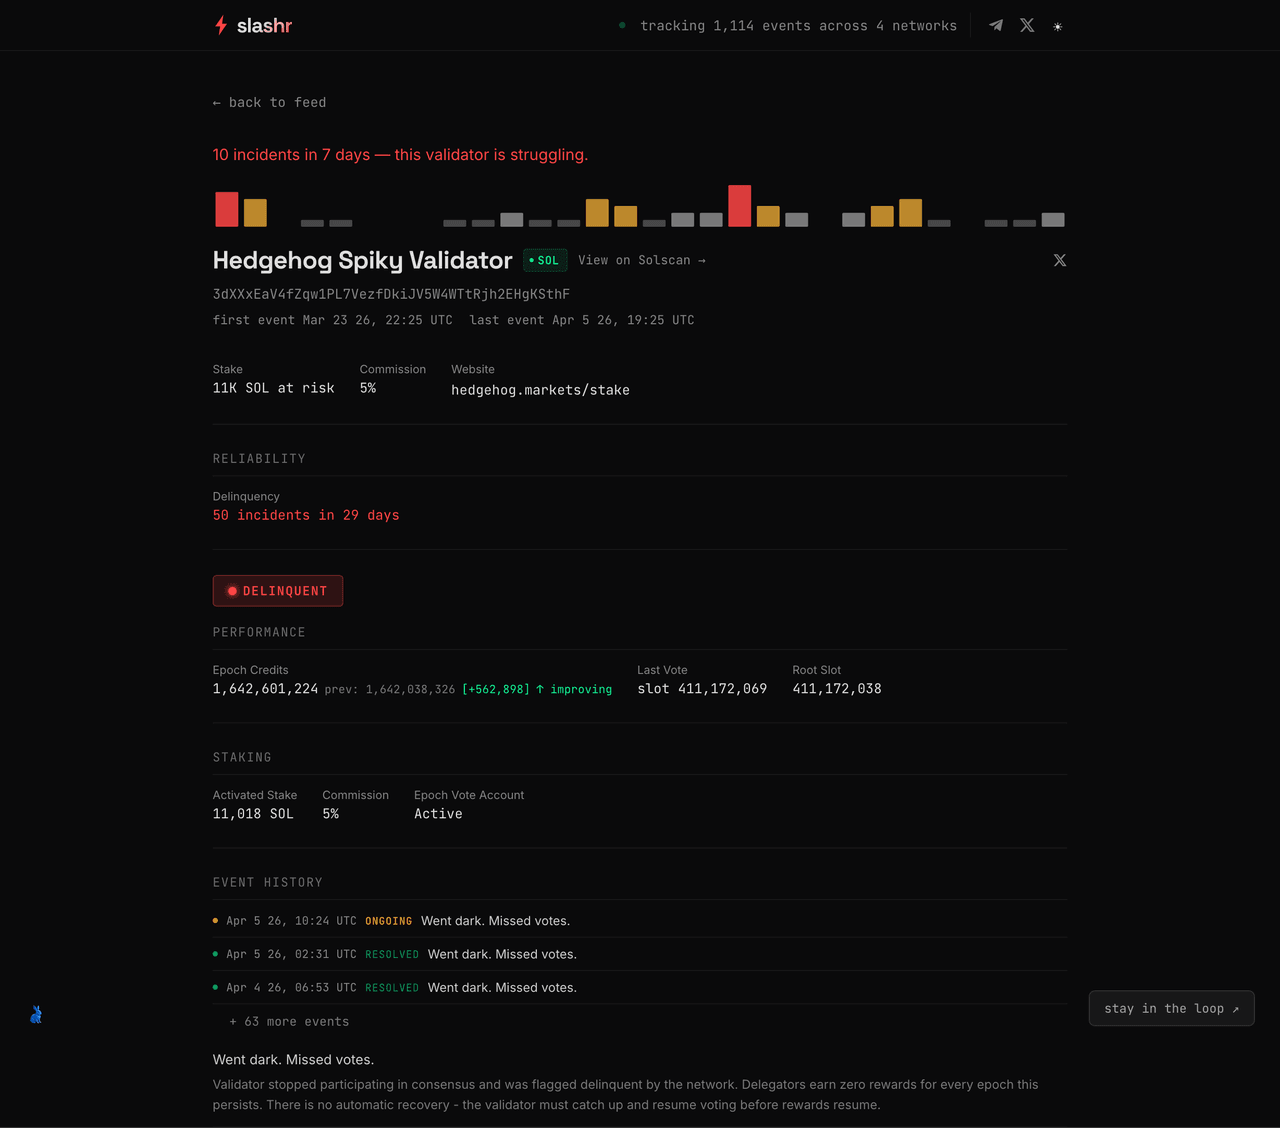
One thing we learned building this: Solana skip rate is a misleading metric for delinquent validators. When a validator is delinquent, it gets removed from the leader schedule entirely, so its skip rate shows 0%. That looks great on paper. It's meaningless. We replaced it with a delinquency frequency metric that actually tells you something useful: "3 incidents in 21 days" is a much clearer signal than a skip rate that resets every time the validator falls off the schedule.
Worst Offenders & Rankings
The rankings page surfaces the validators with the worst incident records, scored by severity, across configurable time periods (7d, 30d, 90d, all-time) and filterable by network.
Default view: Worst Offenders. Toggle to Most Reliable if you want to see who's actually doing the job well.
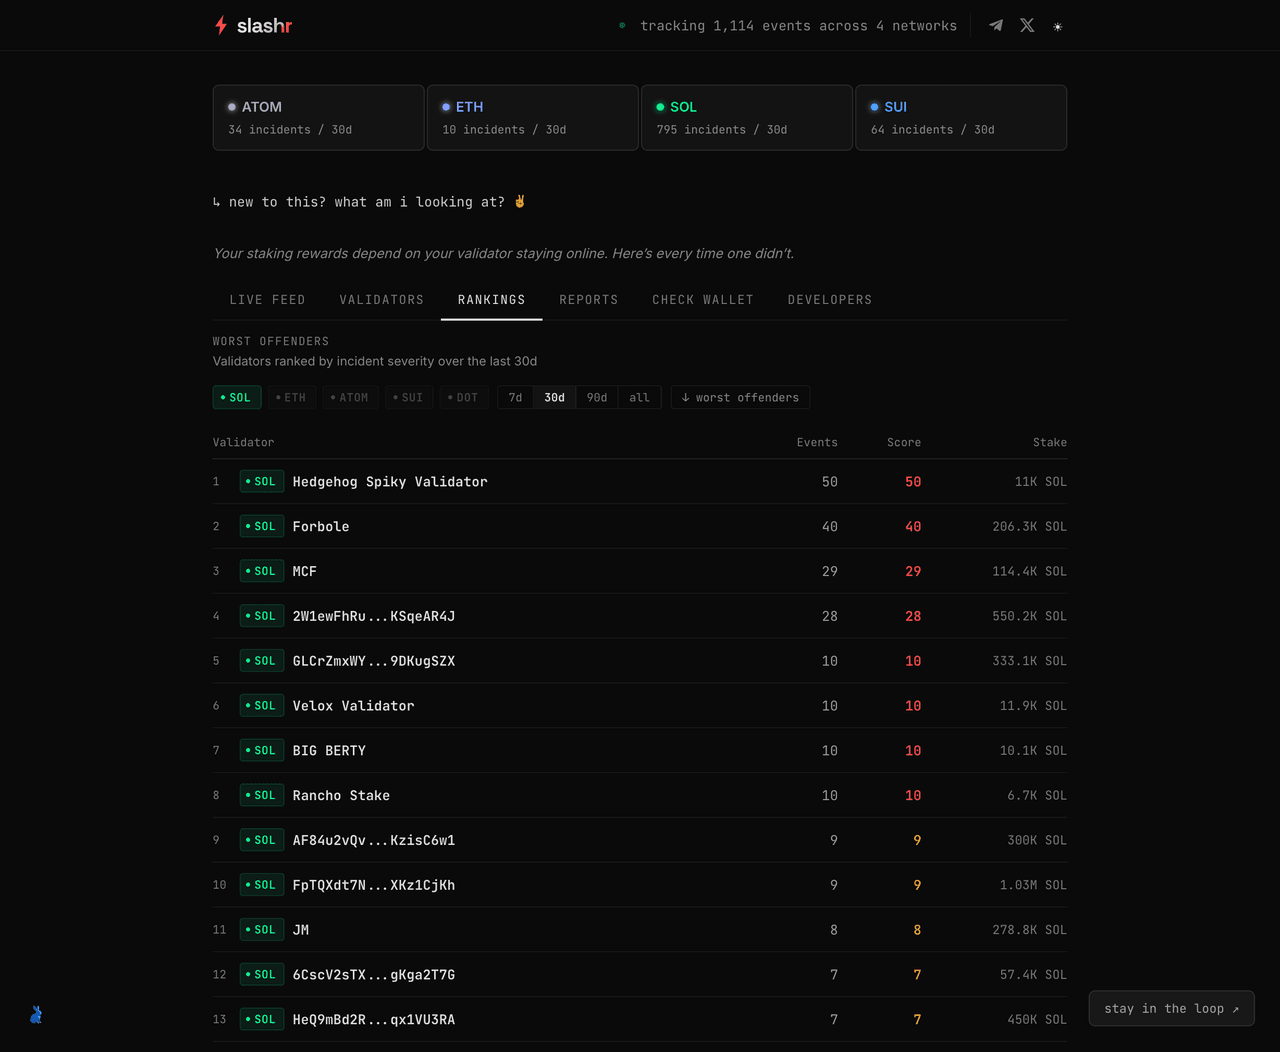
Rankings data refreshes every 15 minutes. This is the kind of content that sparks conversation. Tagged operators tend to respond, and delegators start asking questions.
Automated Infrastructure Scanning
This is the feature that nobody else does.
When a validator goes delinquent on any supported chain, Slashr automatically triggers an infrastructure scan. The scan checks which ports are open, what services are exposed, whether there are known CVEs on those services, and, critically, what likely happened.
The diagnosis is chain-aware. If a Solana validator's RPC and WebSocket ports are down but gossip is still up, that's a validator process crash on a box that's still alive. Different failure mode from a full node outage. Different fix.
Scan results are published directly on the validator's detail page and as a threaded reply under the original incident tweet on @SlashrDev.
Repeat patterns get called out explicitly. "2nd outage in 5 days, same failure mode" tells an operator something they need to hear.
Automated Twitter & Telegram Alerts
@SlashrDev tweets every significant validator incident with LLM-generated editorial copy, not templates. Each event is scored by severity, stake size, repeat offender status, and network coverage balance. A priority queue ensures the most newsworthy events surface within a hard budget of 10 tweets per day.
When a scan completes, the diagnosis is published as a threaded reply under the original incident tweet. Incident -> scan -> diagnosis -> published. Fully automated.
For group alerts, the @SlashrDevBot Telegram bot can be added to any validator community group. Subscribe by network, set severity thresholds, configure quiet hours. Commands: /subscribe, /unsubscribe, /status, /threshold, /quiet.
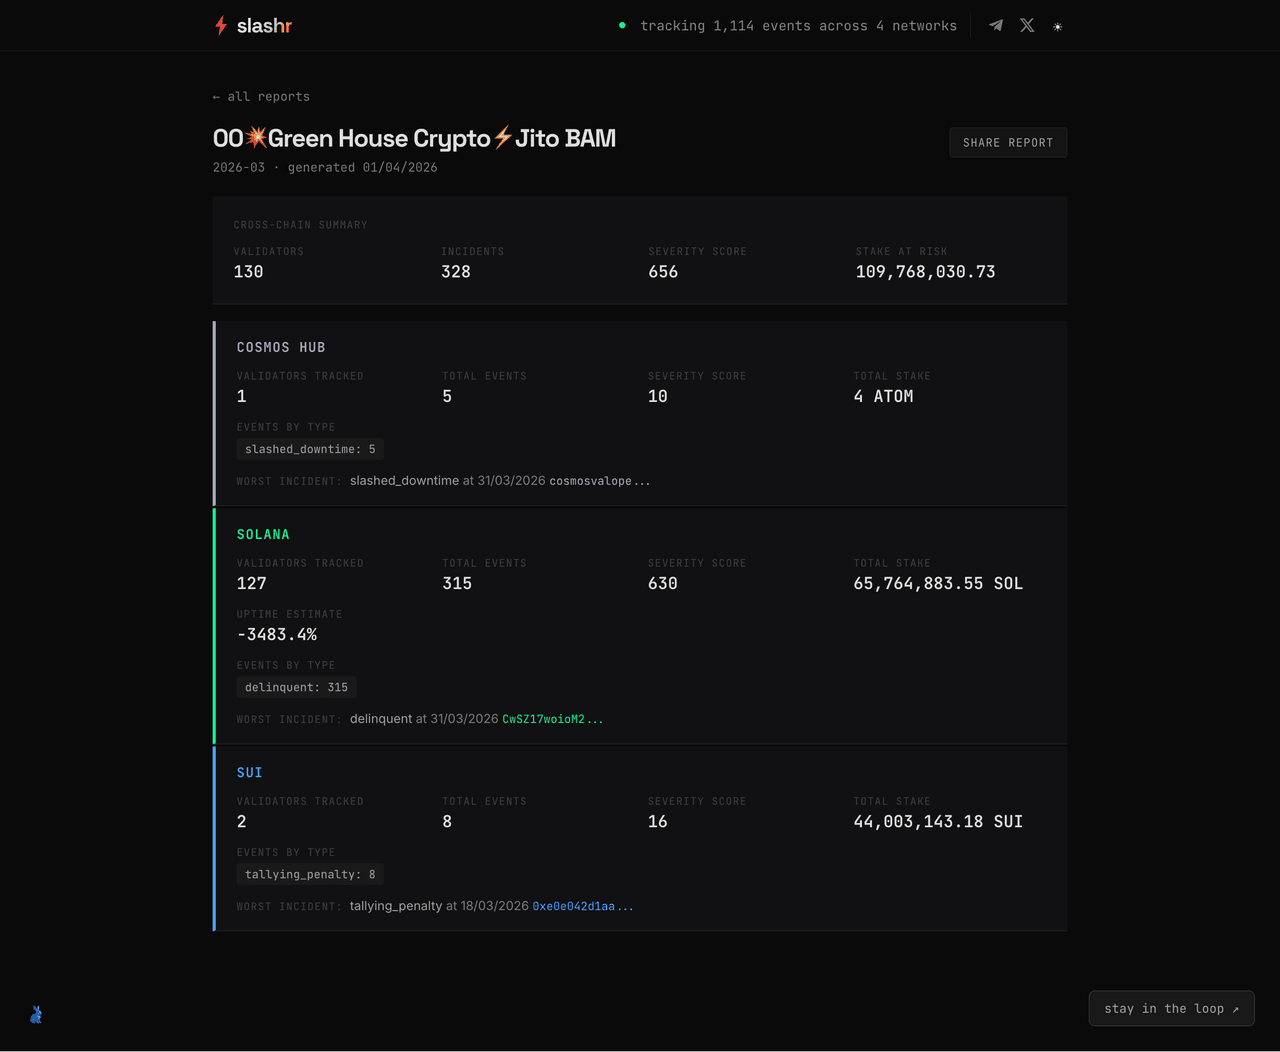
Reliability Reports
Slashr auto-generates monthly reliability reports for staking providers, published at /reports/:provider_slug. Each report includes a cross-chain summary (total validators operated, total incidents, severity score, and stake at risk) with per-network breakdowns and uptime estimates where the data supports it.
MCP Server for AI Agents
Slashr now exposes a Model Context Protocol (MCP) server at mcp.slashr.dev, letting AI agents and tools like Claude query validator incident data programmatically. Six tools are available: get_validator_incidents, get_validator_stats, get_scan_results, get_worst_offenders, check_delegation, and get_network_summary.
We've written a separate blog post covering the MCP integration in detail, including setup instructions for Claude Code.
What's Next
The product answers a question nobody else does: what is this costing me? Competing tools tell you what you'll earn. Slashr tells you what you've lost. The loss calculation engine is live, translating validator incidents into estimated dollar losses and assigning A-F portfolio grades.
Polkadot support is in progress. The MCP server is open for early access. And the data keeps accumulating: every incident, every scan, every diagnosis, building a record that validators can't scrub and delegators can actually use.
Check your validators at slashr.dev/check. Follow @SlashrDev for live incidents. Add @SlashrDevBot to your Telegram group.
Slashr is built by NullRabbit. All incident data is derived from on-chain sources. No validator cooperation required.
Related Posts
Connecting Slashr to Your AI Workflow via MCP
Slashr now has a Model Context Protocol server. Any MCP-compatible AI tool (Claude Code, Claude Desktop, or custom agents) can query live validator incident data, scan results, and network summaries directly.
Introducing Slashr: A Live Feed of Every Validator Incident
Validators go down constantly. Almost nobody is watching it happen in real time, across chains, in one place. So we built slashr.dev, a live incident feed tracking Solana, Ethereum, Sui, and Cosmos.
We Scanned 5,700 [Solana, Eth, Sui, Atom] Validators. Here's What We Found.
NullRabbit scanned 5,715 validator hosts across Solana and Sui, running 10,139 scans and identifying 1,340 CVE findings across 155 hosts. Here's what the validator attack surface actually looks like.