DeFi Under the Microscope: 1,075 Hosts, 3,001 Ports, One Timing Scan
DeFi Under the Microscope: 1,075 Hosts, 3,001 Ports, One Timing Scan
A first look at what DeFi validator infrastructure looks like at the kernel level.
In our previous post, we introduced the idea that every network service has a timing fingerprint -- a measurable, high-dimensional signature produced by the way a machine responds to TCP SYN packets at microsecond precision. Here we crack open the consolidated dataset from our scans across multiple DeFi validator networks -- including Sui, Solana, and others -- and walk through what we found.
This is a work-in-progress first look at the combined data. Future posts will break this down by individual network to compare their physical topologies. For now, we're interested in the aggregate picture: what does DeFi validator infrastructure look like as a whole?
The scan covered 1,075 hosts and 3,001 individual port-level services. Every data point was captured by Limpet, our eBPF/XDP scanner, operating at the kernel boundary -- below anything a service can deliberately manipulate.
The embedding galaxy: structure from chaos
The first question: does the timing data have structure, or is it noise?
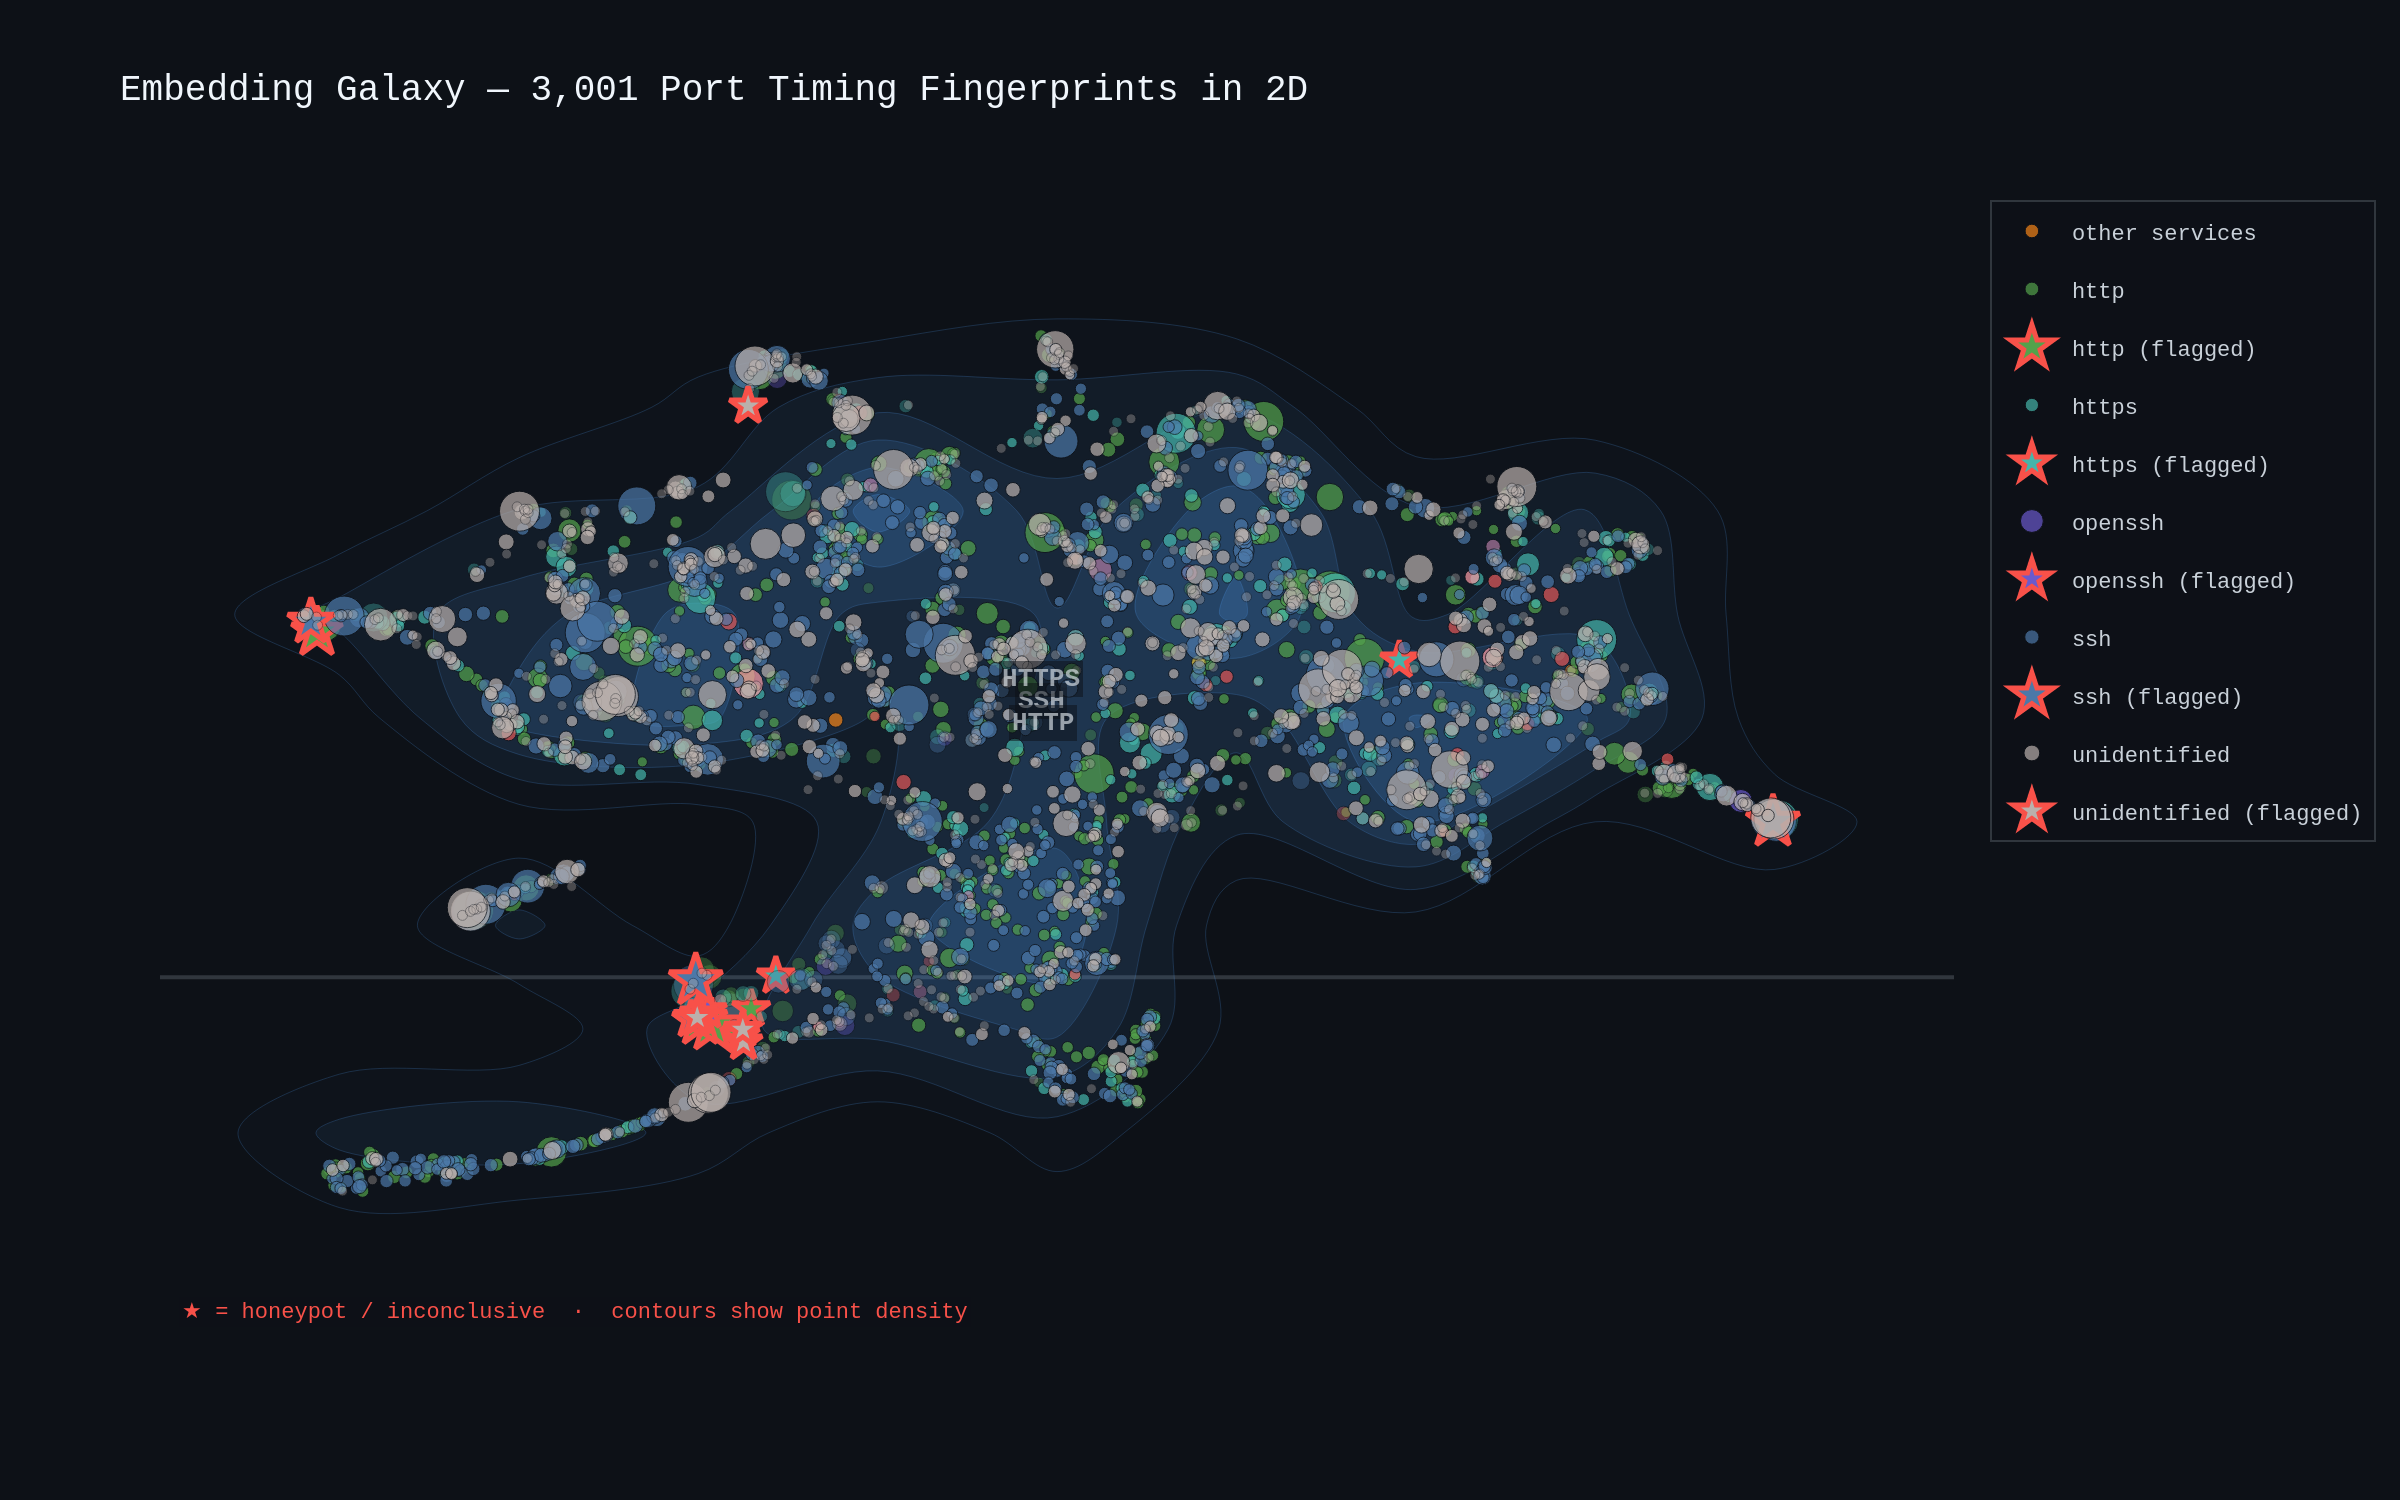
Each dot represents one port on one host. The position comes from projecting its 64-dimensional Network Timing Embedding down to 2D via UMAP. Colour encodes the service type (SSH in blue, HTTP in green, HTTPS in teal). Point size scales with standard deviation -- smaller means more consistent timing.
The structure is immediately visible. Services of the same type cluster together, not because we told the algorithm what they were, but because they genuinely behave similarly at the timing level. SSH daemons occupy a distinct region from HTTP servers. HTTPS forms its own cluster, offset from plaintext HTTP. With data from multiple networks, the clustering is more dispersed than a single-network scan would show -- the different infrastructure environments create sub-clusters within each service type.
The red-outlined stars -- flagged as honeypots or inconclusive -- sit in anomalous positions that are visible even at this scale. Out of 3,001 records, 2,126 were classified as likely real, 18 were flagged (5 likely honeypots, 13 inconclusive), and 857 are pending classification.
Jitter fingerprints: the honeypot tell
The embedding galaxy shows us the macro structure. The jitter fingerprint plot shows us why individual hosts get flagged.
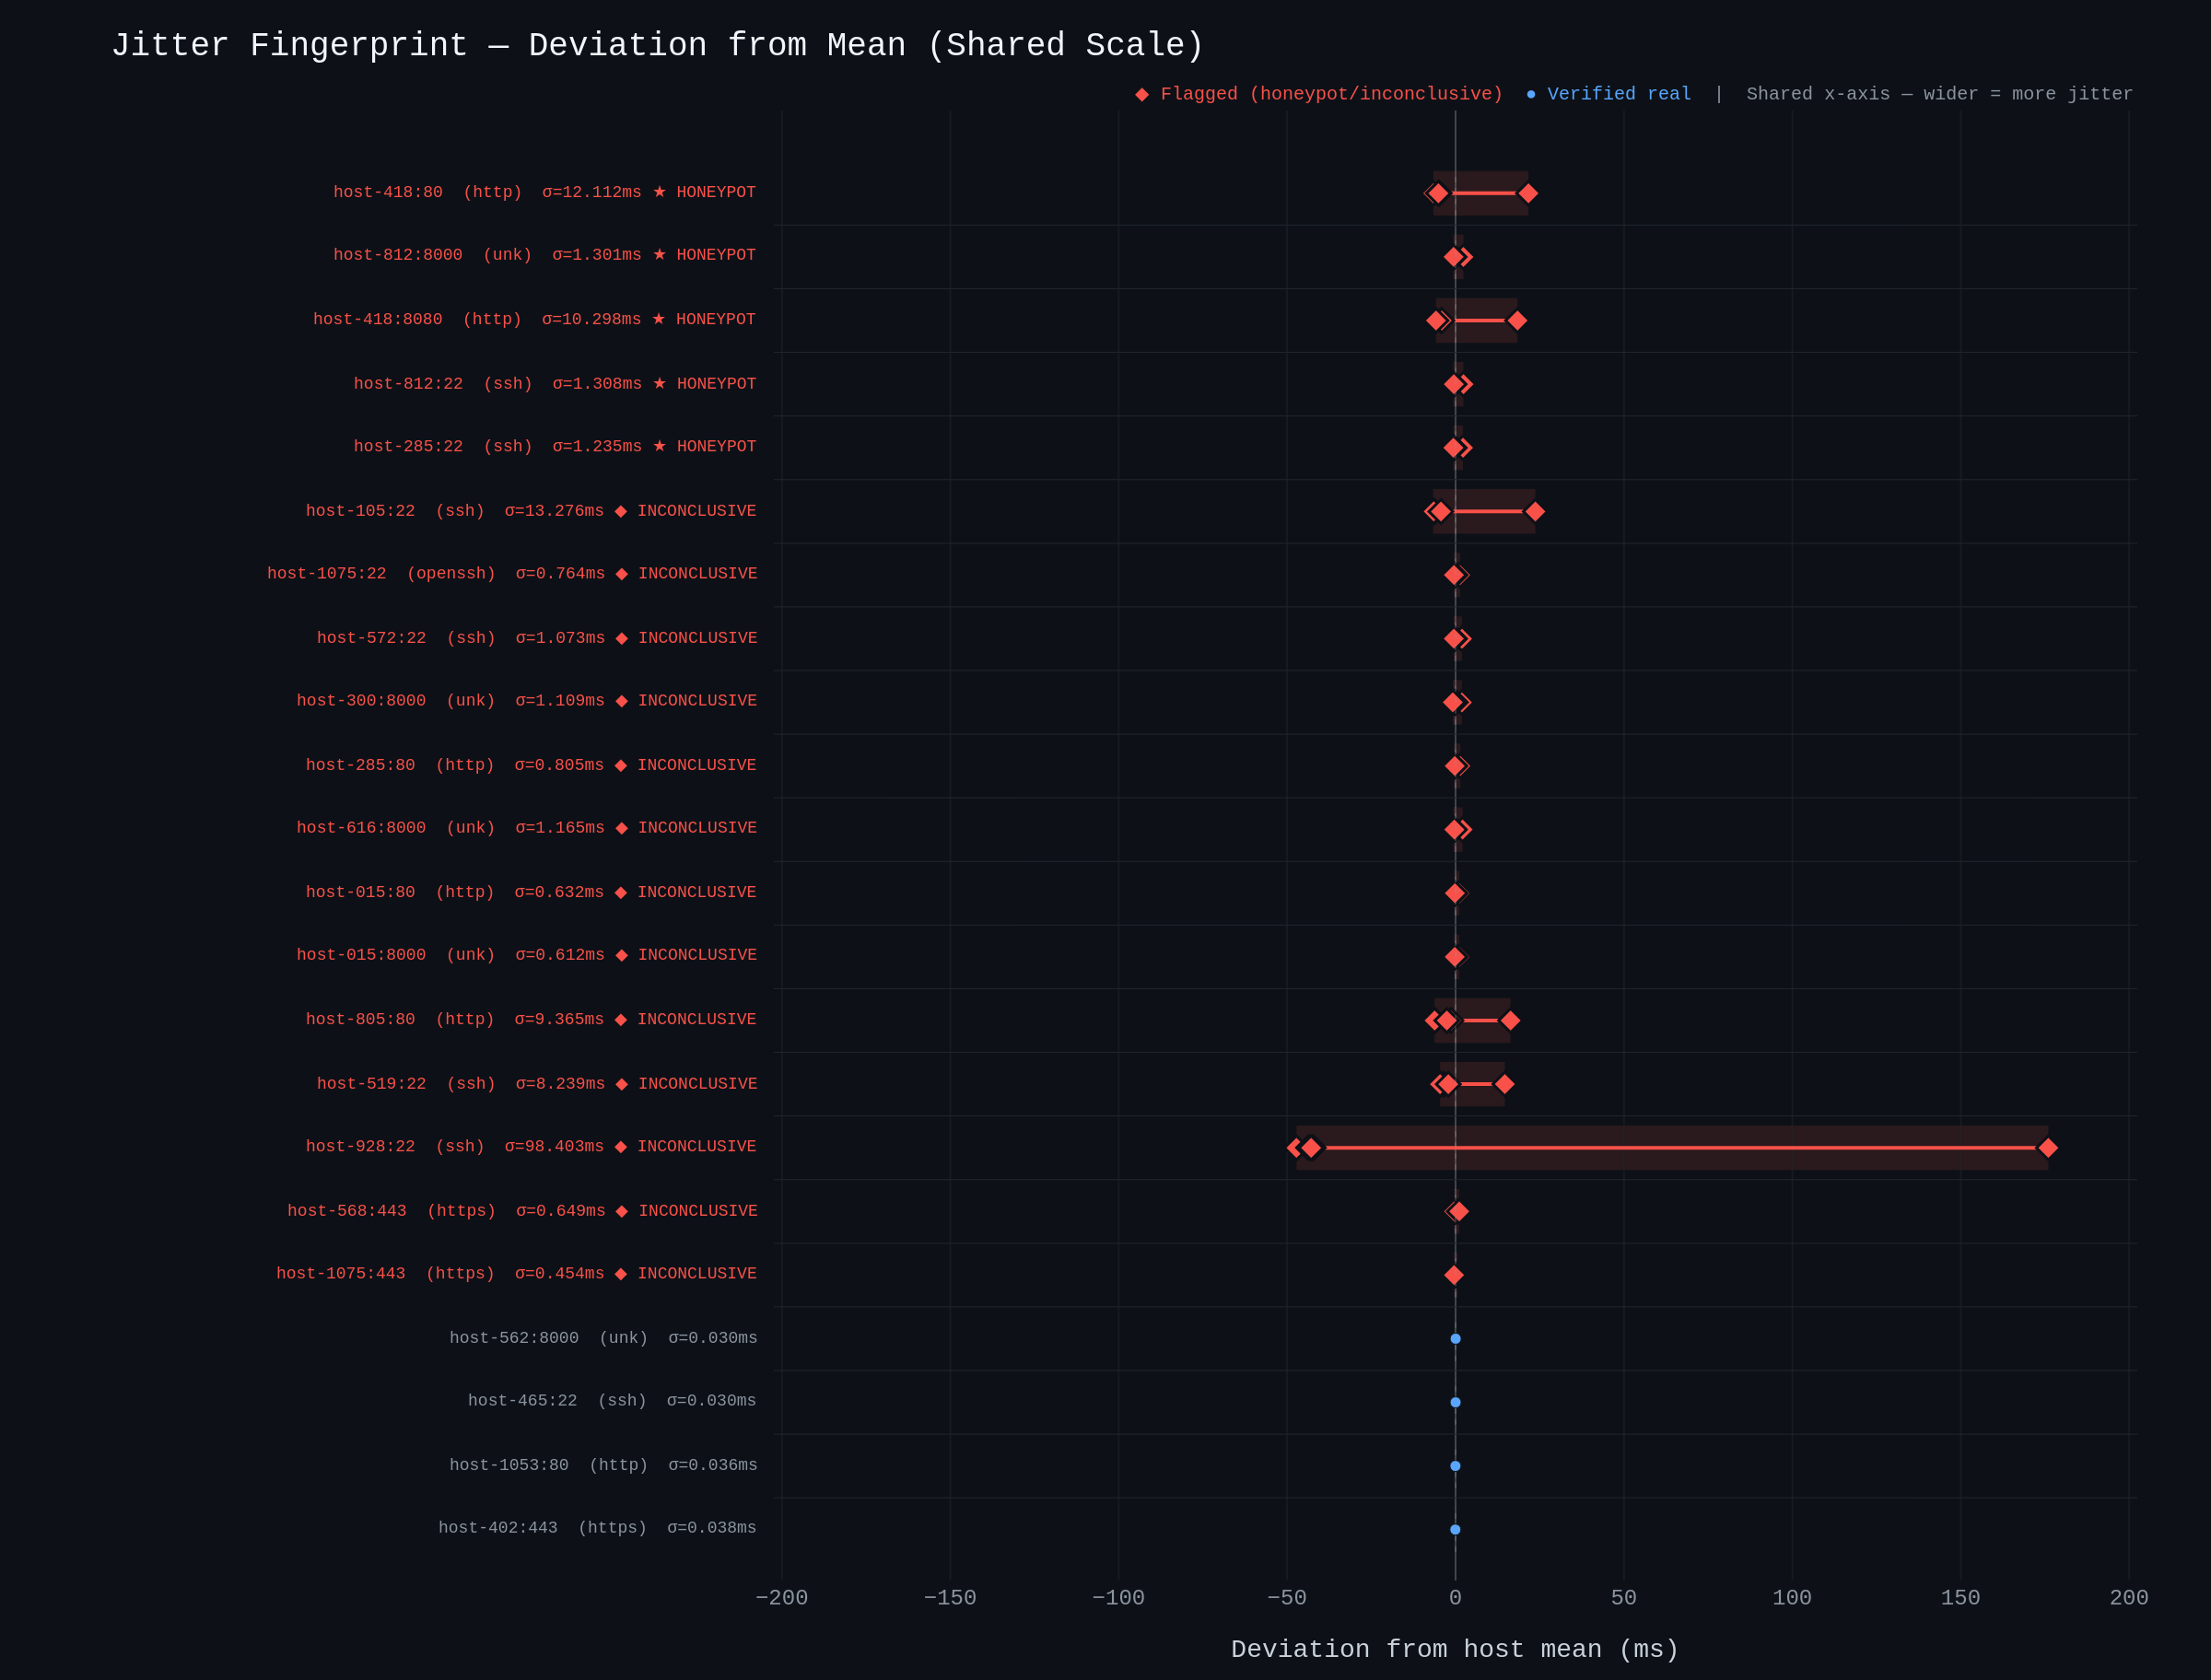
Each row is one host:port combination. The x-axis shows how far each of the five SYN-ACK timing samples deviates from that host's own mean -- and critically, every row shares the same scale. Red diamond markers are flagged (honeypot or inconclusive); blue circles are verified real services. They're sorted with flagged hosts at the top.
The flagged hosts show visibly wider deviation bands than verified services. The 5 confirmed likely-honeypot entries show timing jitter roughly 3x higher than the average real SSH service (sigma of approximately 5.3ms vs sigma of approximately 1.95ms). That ratio is smaller than you'd see in a single-network scan because the consolidated data includes a wider range of infrastructure quality -- budget VPS hosts alongside bare-metal validators -- which pushes the real-service baseline higher.
This is the fundamental weakness of honeypots from a timing perspective. A honeypot can copy a banner, fake a version string, even emulate protocol behaviour. But it typically runs on different infrastructure than the services it mimics -- often virtualised, multi-tenant, or deliberately designed to capture and log connections. That extra processing introduces timing jitter that isn't present in a real service doing its actual job.
The 13 inconclusive cases show elevated jitter without reaching the threshold for a confident honeypot classification -- a grey zone that could indicate overloaded machines, misconfigured services, or something more deliberate.
RTT by service: each service has a signature
Zooming out from individual hosts, the RTT ridge plot shows the timing distribution across entire service types.
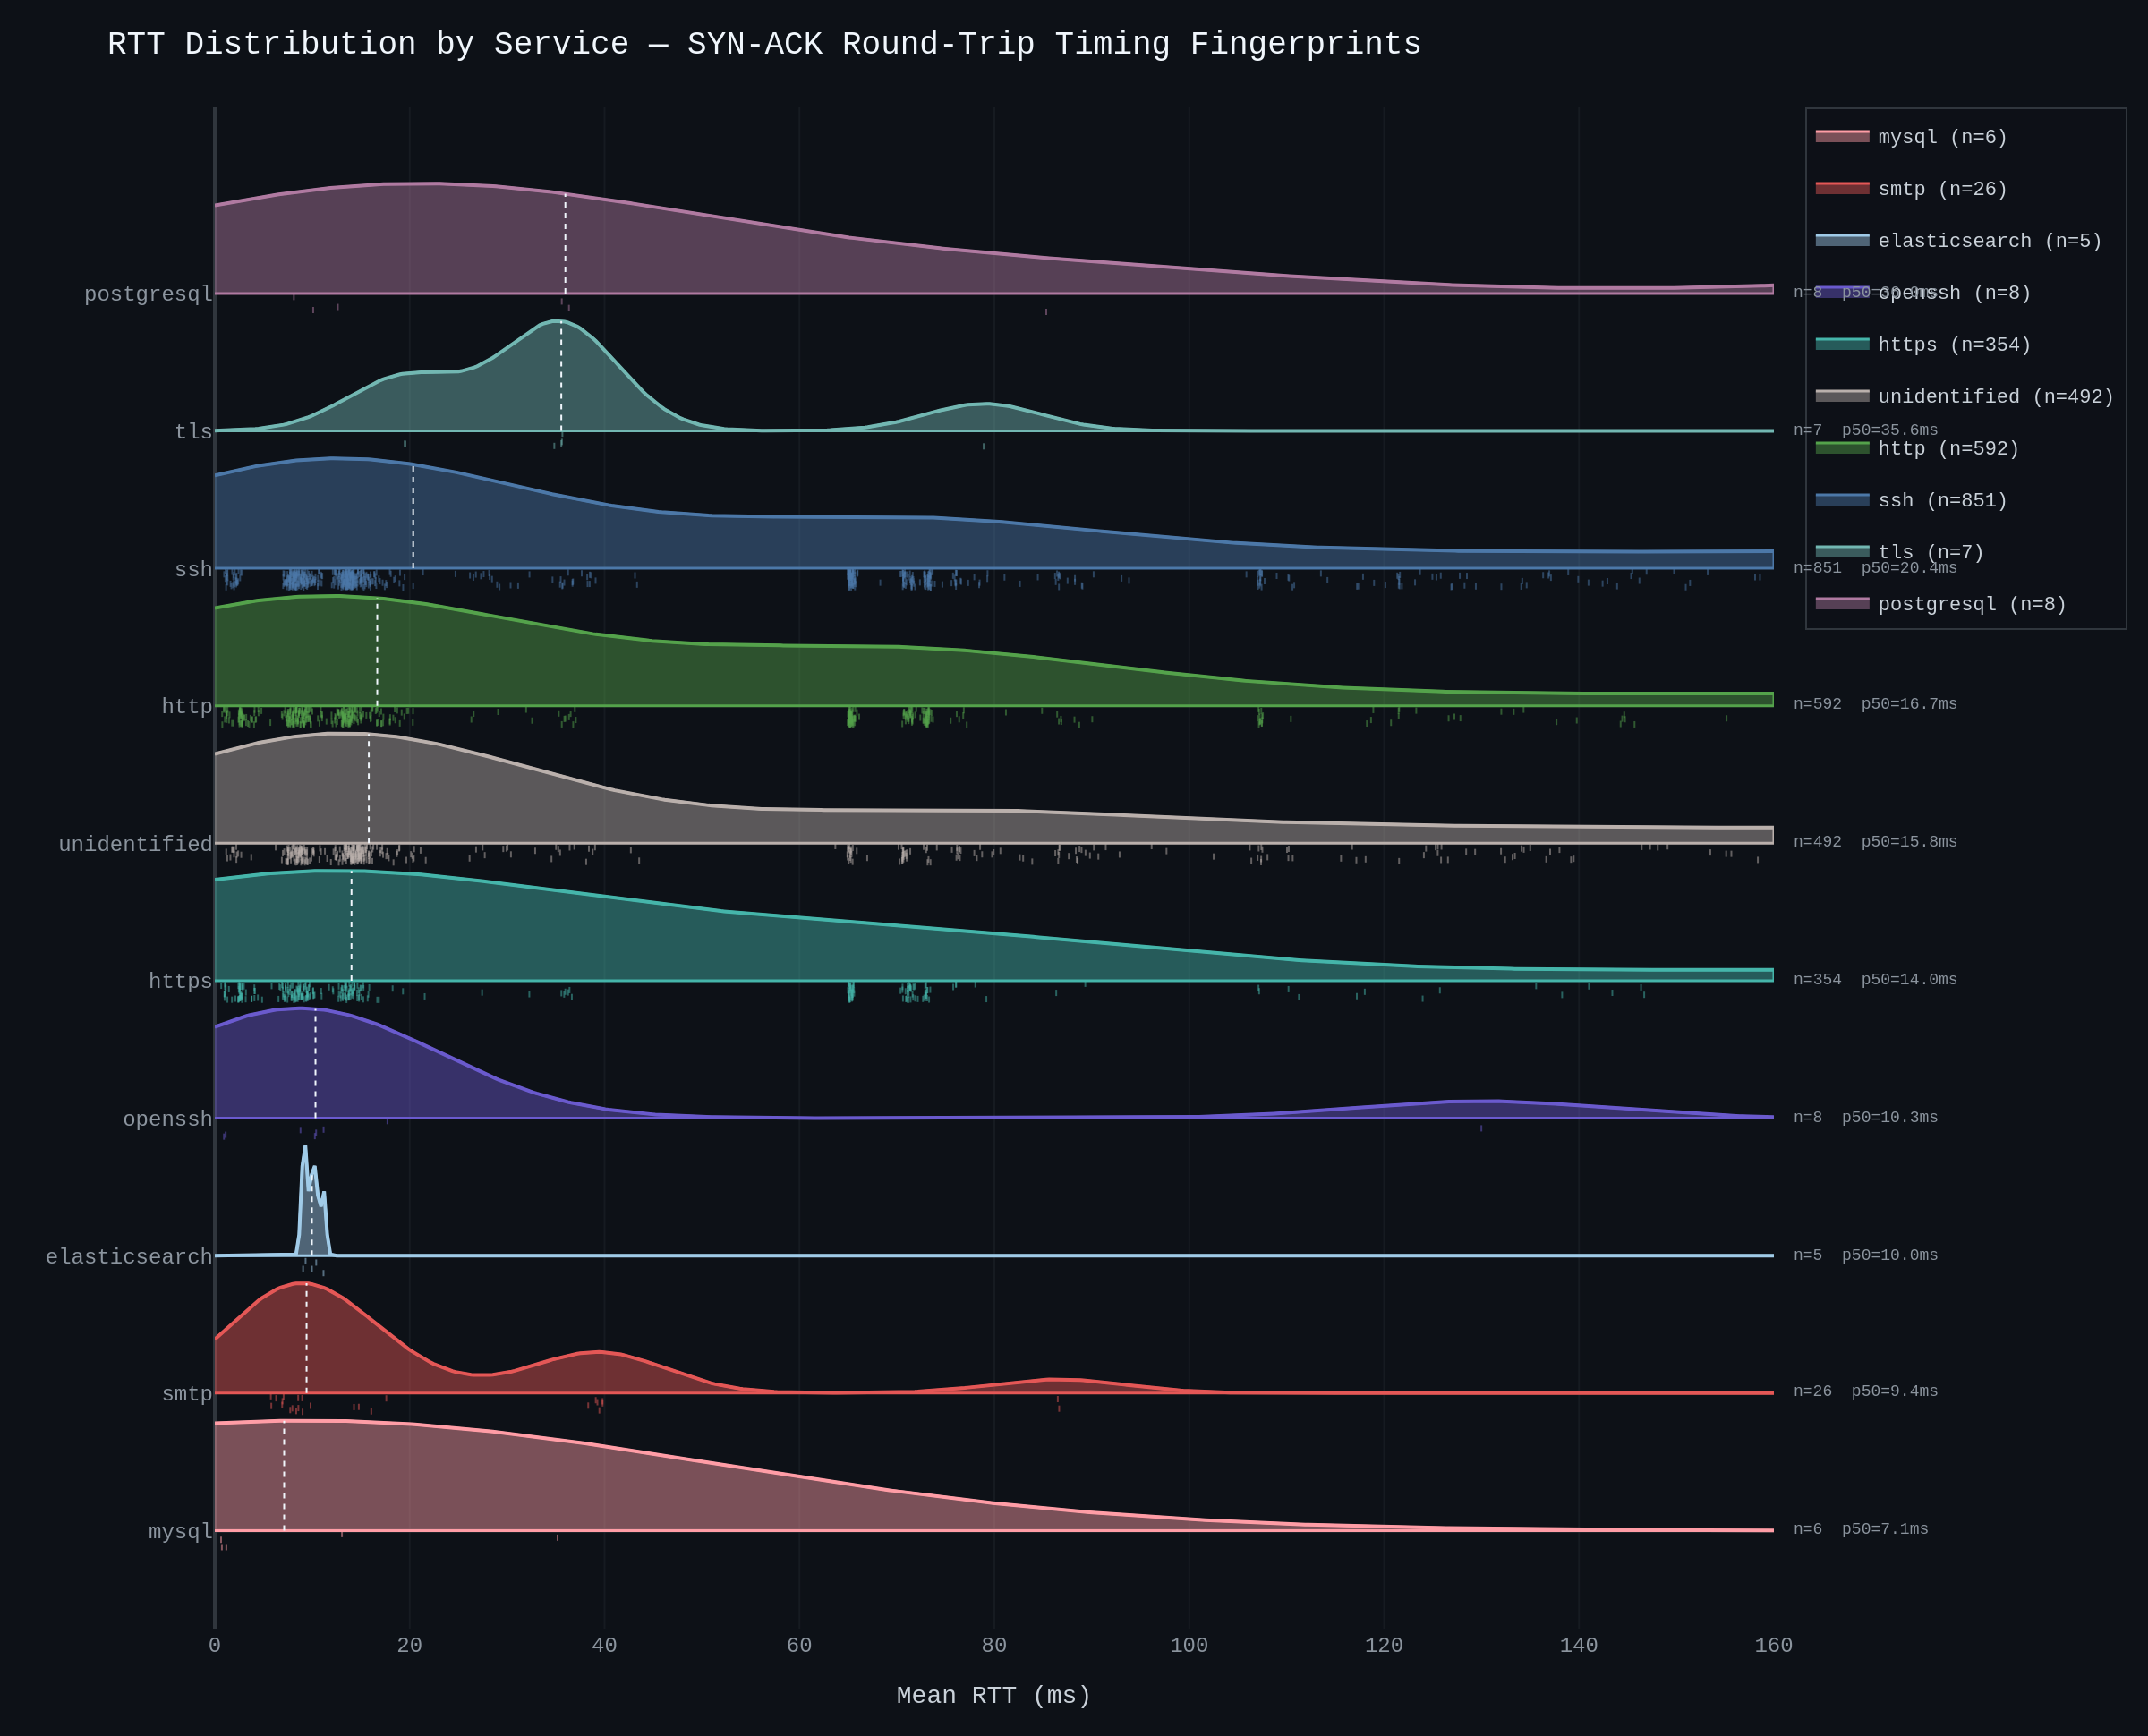
The distributions aren't random. Each service type occupies a characteristic band:
SSH is the largest population (817 verified instances), clustering around 65ms mean RTT with a standard deviation of ~1.95ms. The spread is wider than a single-network scan would show, reflecting the diversity of hosting environments across multiple validator networks.
HTTP (504 instances) clusters around 62ms, with slightly tighter jitter than SSH (sigma of approximately 1.45ms) -- consistent with HTTP's simpler handshake path.
HTTPS (284 instances) sits around 58ms. The lower RTT compared to plaintext HTTP likely reflects that HTTPS endpoints tend to be better-provisioned infrastructure -- CDNs, dedicated reverse proxies, or managed load balancers.
SMTP (19 verified instances) clusters around 28ms with moderate consistency. The sample is smaller but the distinct RTT band is visible.
PostgreSQL (8 instances) responds at ~79ms, sitting above the SSH/HTTP band. Database services typically have heavier connection-handling overhead.
The rug strips beneath each curve show individual data points -- you can see the actual density of the measurements, not just the smoothed distribution.
The anomaly layer: 10,000 events, 642 silent hosts
Beyond the static scan, Limpet produces a continuous anomaly feed -- deviations from established baselines detected during the scan window.
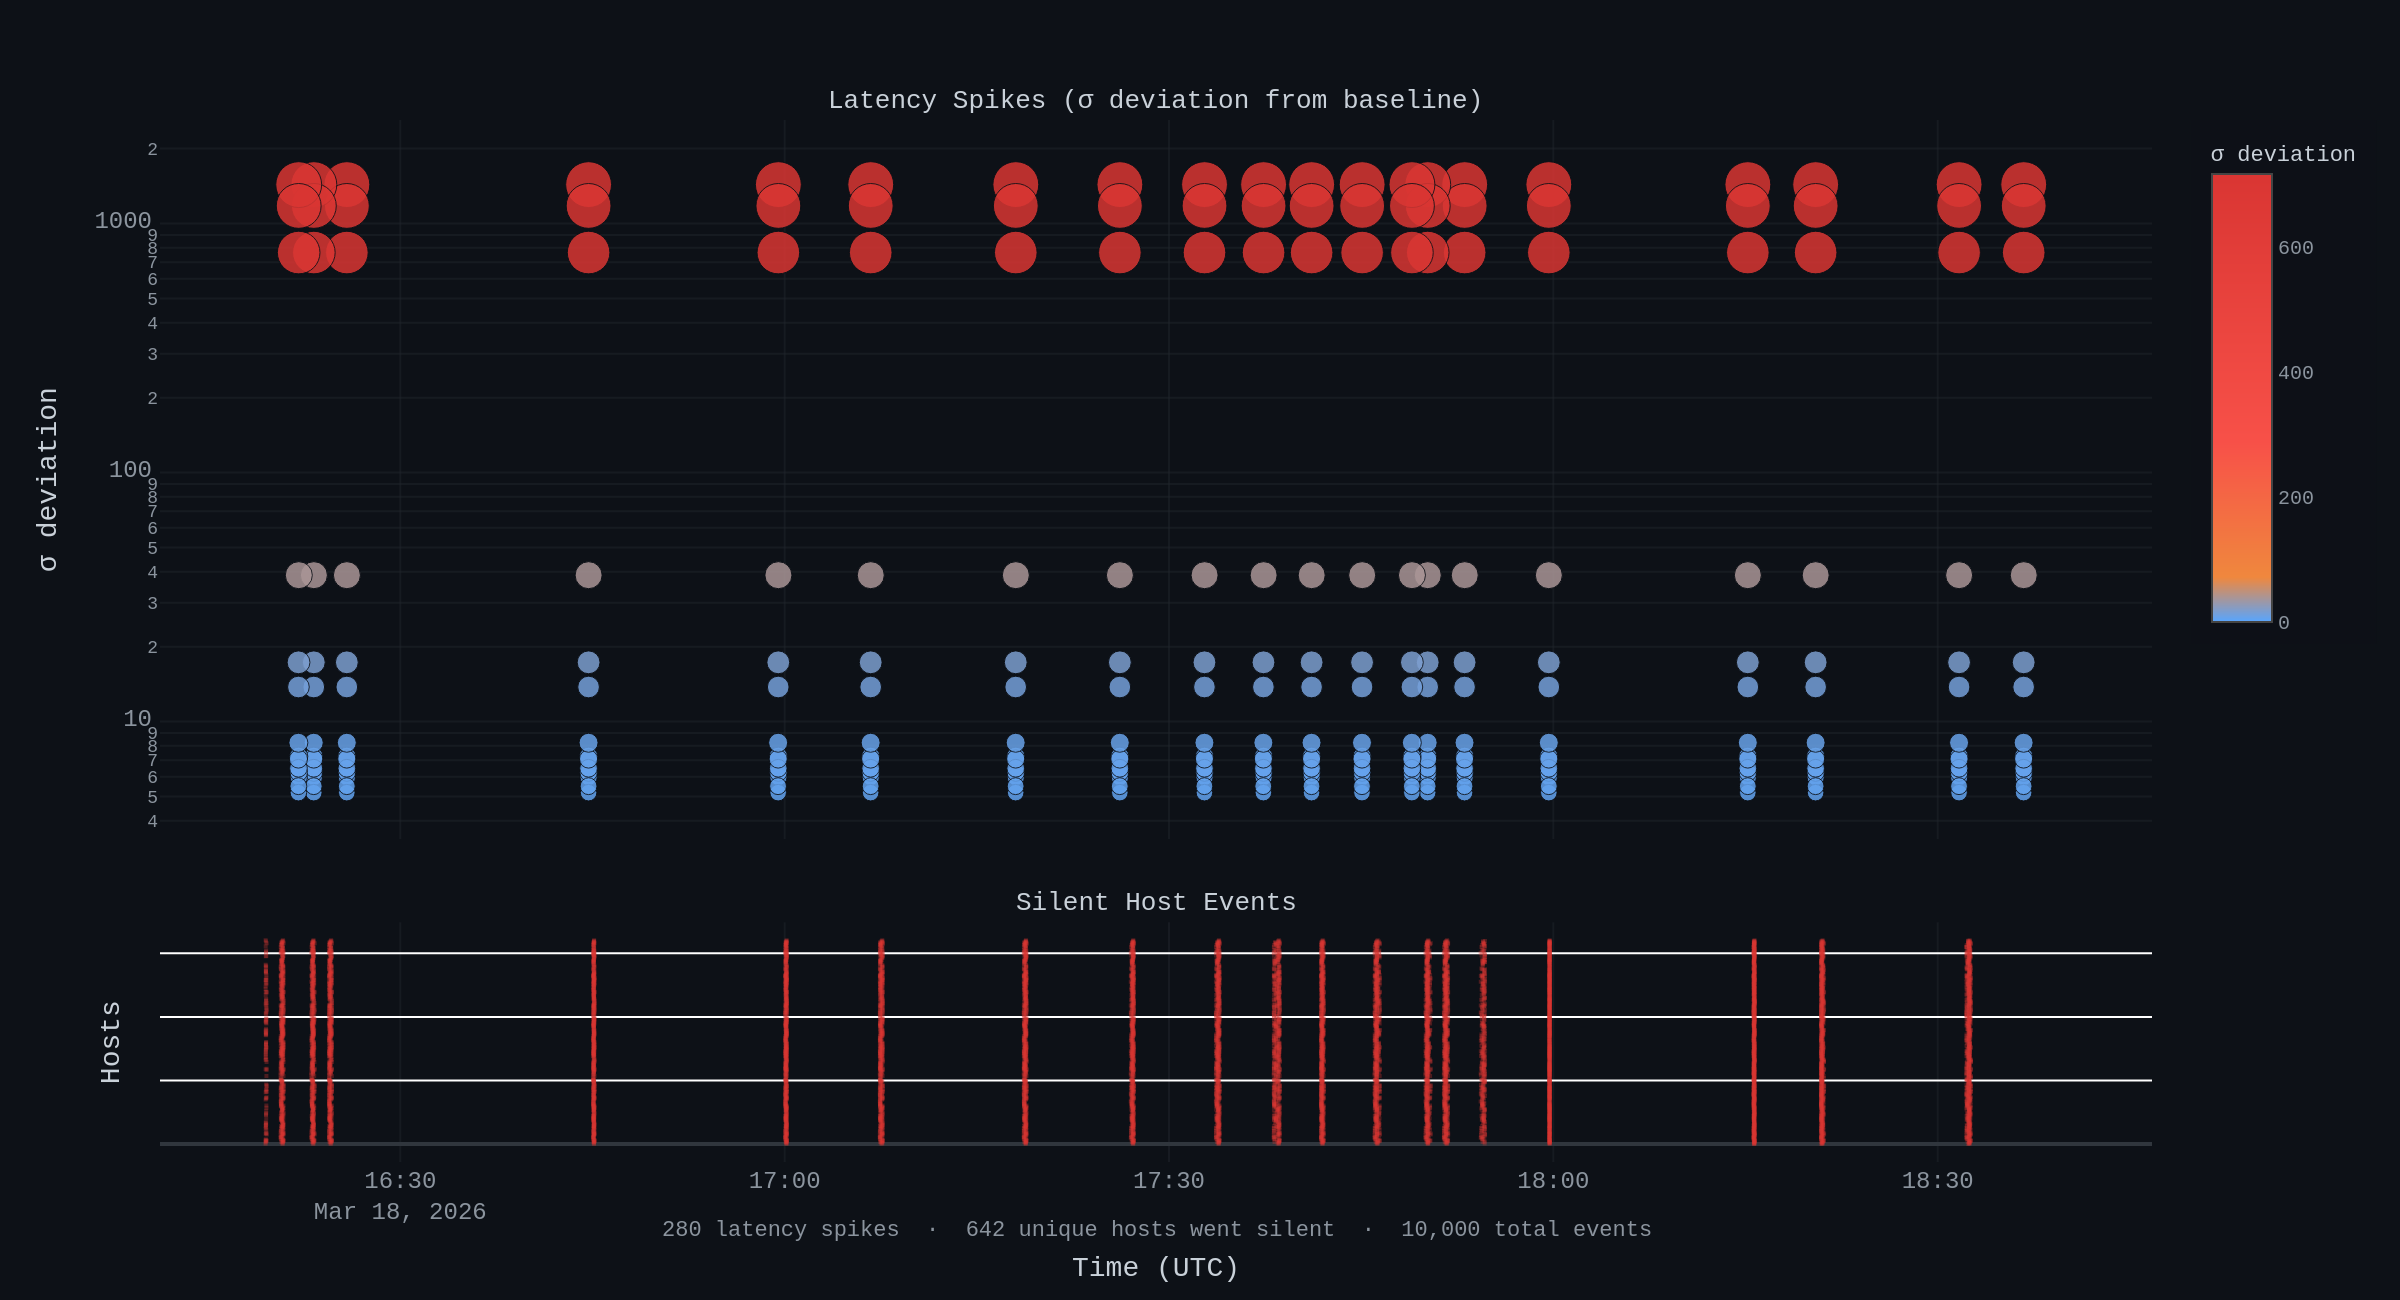
The scans generated 10,000 anomaly events across two categories:
Silent hosts (9,720 events across 642 unique hosts). These are machines that stopped responding entirely during the scan window. In a validator network, a host going silent could mean planned maintenance, a crash, a network partition, or something more concerning. The volume is notable -- 642 unique hosts going dark during a single scan window tells you that DeFi validator infrastructure has significant churn at the physical level.
Latency spikes (280 events). These are cases where a port's observed latency deviated significantly from its established baseline. The most extreme case showed a 1,434 sigma deviation on a single port -- an observed latency of over 1,000ms against a 3ms baseline. This kind of deviation suggests a fundamental change in routing or hosting rather than transient load.
What this means so far
Three early takeaways from the consolidated data:
The infrastructure has real structure. Even across multiple networks with different architectures and validator economics, timing embeddings reveal meaningful patterns. Services cluster by type. Infrastructure quality varies in predictable ways. This is a signal that can be monitored continuously.
Honeypots are detectable across networks. 18 flagged hosts across 1,075 scanned -- a small number, but surfaced entirely from timing behaviour that a honeypot can't easily mask. As we add more scan data, the detection baselines will sharpen.
The physical layer is more volatile than the consensus layer suggests. 642 hosts going silent and 280 latency spikes in a single scan window tells you that the infrastructure underneath DeFi is significantly more dynamic than most people realise.
This is a first pass. The next step is breaking this data down by individual network -- Sui vs Solana vs others -- to see how their physical topologies differ and what that means for security and resilience.
Limpet is open source. The timing data from these scans is available alongside this post.
Related Posts
What Does a DeFi Network Actually Look Like?
Every blockchain network has a physical fingerprint. We pointed our eBPF/XDP scanner at 1,075 hosts across multiple DeFi validator networks and mapped 3,001 timing fingerprints to reveal the structure underneath the consensus layer.
What We Found Scanning the Sui Validator Network
We scanned 138 Sui validators across 20 countries using kernel-level temporal fingerprinting. 41% have SSH exposed, 57 run unexpected internet-facing services, and 9 confirmed CVEs sit on 4 hosts -- including 2 critical at CVSS 9.8. Here is what we found and why it matters for DeFi.
Open-Sourcing Our Autonomous Defence Arsenal: Here's What's Inside
We're open-sourcing the tooling behind NullRabbit's autonomous kernel-level network defence: the scanning, intelligence, observation, and adversarial validation layers that feed our enforcement pipeline. Six tools, MIT licensed, with more coming.